Catalog of simulated star clusters and DM halos at high redshift
This catalog contains simulated object properties derived from a suite of AREPO cosmological simulations. The data come from simulation snapshots taken at \( z = [12,13,14,15] \). The simulations and star cluster properties are discussed in detail in Williams et al (2025). The star cluster catalog given here is the same data as the stars and gas primary dataset from Williams et al. (2025). The dark matter halos are additionally provided below, corresponding to the dark matter primary, gas and stars secondary structures from that work.
Download the star clusters:
You can download the dataset in HDF5 format (1.47 MB) using the following:
wget https://raw.githubusercontent.com/astro-claire/arepo-clusters/main/starcluster_data.hdf5or alternatively from GitHub directly.
Open the data in Python:
Use the following Python code to download and load the data using Astropy Table:
from astropy.table import Table
import requests

# Download the file
url = 'https://raw.githubusercontent.com/astro-claire/arepo-clusters/main/starcluster_data.hdf5'
response = requests.get(url)

# Save to local file
with open('starcluster_data.hdf5', 'wb') as f:
    f.write(response.content)

# Load the data for a specific redshift
starcluster_table = Table.read('starcluster_data.hdf5', path='redshift_12')

# Display the first few rows
print(starcluster_table[:5])
The available catalogs (accessed by the path keyword argument) are 'redshift_12', 'redshift_13', 'redshift_14', 'redshift_15'.
The metadata includes important information such as the redshift, cosmological parameters, and information about the structure finding algorithm:
print(starcluster_table.meta)Accessing star cluster parameters:
The following properties are available for the star clusters:
- stellarMass (Msun): Stellar mass (in solar masses).
- gasMass (Msun): Gas mass (in solar masses).
- virialized: Virialization status of object: 1 if virialized, 0 if not.
- radius_hm (kpc): Half mass radius of object (in kpc).
- DMMass_<r (Msun): Mass of DM contained within either virial radius (if virialized) or FOF output radius (if not virialized) (in solar masses).
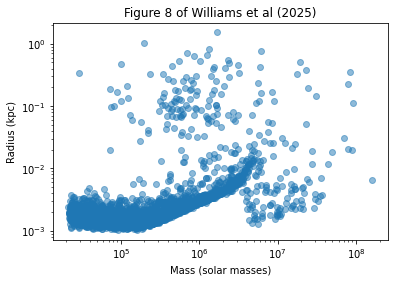
To access star clusters properties and make a simple plot in python with matplotlib:
from astropy.table import Table
import matplotlib.pyplot as plt

# Load the data for a specific redshift
starcluster_table = Table.read('starcluster_data.hdf5', path='redshift_12')

# Access specific properties
masses = starcluster_table['stellarMass (Msun)']
radii = starcluster_table['radius_hm (kpc)']

# Create the figure and axes
fig, ax = plt.subplots()

# Create the scatter plot with log axes
ax.scatter(masses, radii, alpha=0.5)
ax.set_xscale('log')
ax.set_yscale('log')

# Add labels and title
ax.set_xlabel('Mass (solar masses)')
ax.set_ylabel('Radius (kpc)')
ax.set_title('Figure 8 of Williams et al (2025)')

plt.show()
Dark Matter halo data:
We additionally provide a catalogue of dark matter halos in the simulation. Please refer to Williams et al (2025) for a detailed discussion of the difference between structures identified as DM halos (below) and as star clusters (above). The halo catalog contains slightly different properties:
- DMMass (Msun): Dark matter mass (in solar masses).
- stellarMass (Msun): Stellar mass (in solar masses).
- gasMass (Msun): Gas mass (in solar masses).
- virialized: Virialization status of object: 1 if virialized, 0 if not.
- radius (kpc): Halo radius defined by \( r_{200} = r(\rho = 200\rho_{crit}) \) (in kpc).
Download the DM halo catalog:
You can download the dataset in HDF5 format (2.12 MB) using the following:
wget https://raw.githubusercontent.com/astro-claire/arepo-clusters/main/dmhalo_data.hdf5or alternatively from GitHub directly.
Contact:
For any questions or feedback, please contact Claire Williams (UCLA) via email at clairewilliams@astro.ucla.edu.
Reference:
Please cite Williams et al (2025) when using this dataset in publications.
Date of last update: Friday, February 14th, 2025.